[2016_Include_Web_Demo_Schedule.html]
|
|
Hourly Data in Trane Trace

Generate Hourly Data from Trane Trace
To generate data after setting up your loads information, go to the “Graph Profiles and Energy” in the Results section of Trane Trace: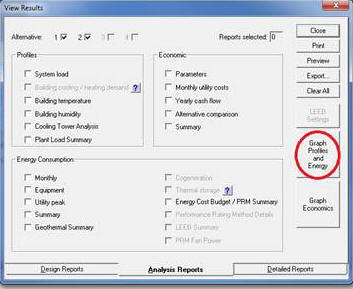 Once there, you can find all kinds of information available on an hourly basis. It
will look similar to the screen below. Make sure that you select the
full year (ie. Jan to Dec, days 1 through 31, hours 1 through 24), and that
demand is selected rather than consumption.
Once there, you can find all kinds of information available on an hourly basis. It
will look similar to the screen below. Make sure that you select the
full year (ie. Jan to Dec, days 1 through 31, hours 1 through 24), and that
demand is selected rather than consumption.
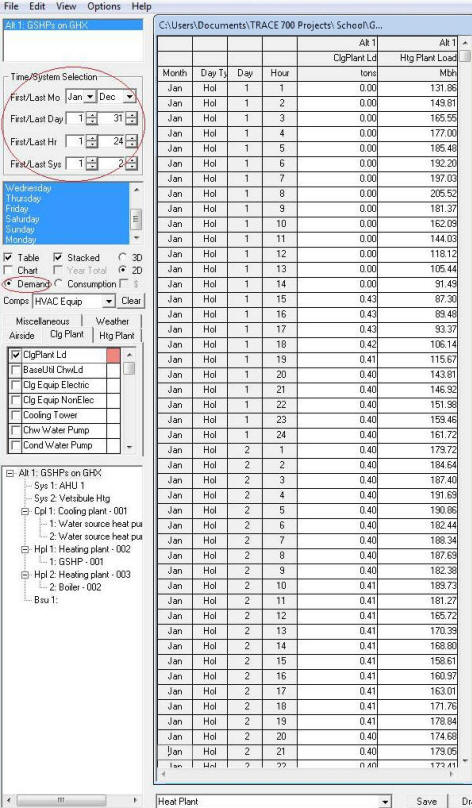 This will generate the full 8760 data. Care should be
taken when setting up the model and which data points are selected. As
an example, this screenshot example shows the heating and cooling plant load on the screen shot
for both Systems 1 and 2. In this case, System 2 is not geothermal,
and System 1 has a gas fired makeup air unit, so these loads will show
higher loads than the monthly loads than communicated through the gt# files.
You can select different data points, which depending on how the model has
been set, may or may not be better. All the information is available in the
Project file spreadsheet called (Project Name)_Profiles.csv where you
have the opportunity to manipulate the data further to put it in the format that GLD
requires. The GLD help files will show the necessary format that is required
from any program.
This will generate the full 8760 data. Care should be
taken when setting up the model and which data points are selected. As
an example, this screenshot example shows the heating and cooling plant load on the screen shot
for both Systems 1 and 2. In this case, System 2 is not geothermal,
and System 1 has a gas fired makeup air unit, so these loads will show
higher loads than the monthly loads than communicated through the gt# files.
You can select different data points, which depending on how the model has
been set, may or may not be better. All the information is available in the
Project file spreadsheet called (Project Name)_Profiles.csv where you
have the opportunity to manipulate the data further to put it in the format that GLD
requires. The GLD help files will show the necessary format that is required
from any program.